Sales Analytics Dashboard
An interactive sales dashboard designed to turn business data into clear visual insights for faster decision-making.
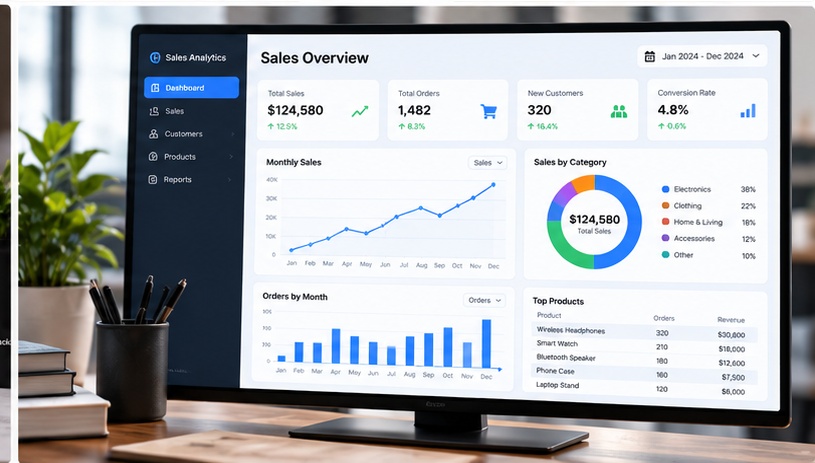
Overview
This project focuses on transforming sales data into an accessible dashboard that allows users to quickly understand business performance. The dashboard brings key metrics, trends, product performance, and customer information into one visual interface.
Challenge
Present large amounts of sales information in a way that allows users to quickly identify important trends, compare performance, and understand the overall state of the business.
Solution
Designed a structured analytics dashboard that organizes key performance indicators, sales trends, category performance, and product information into a single visual experience. Charts and summary metrics make the underlying data easier to interpret and act on.
Outcome
A structured analytics dashboard that makes sales data easier to explore, understand, and use for business decision-making.
Features
- Sales overview dashboard
- Key performance indicators
- Sales trend visualization
- Product performance analysis
- Category breakdowns
- Customer metrics
- Monthly sales reporting
- Interactive data visualization
Technologies
- Python
- Polars
- Pandas
- NumPy
- Matplotlib
- SQL
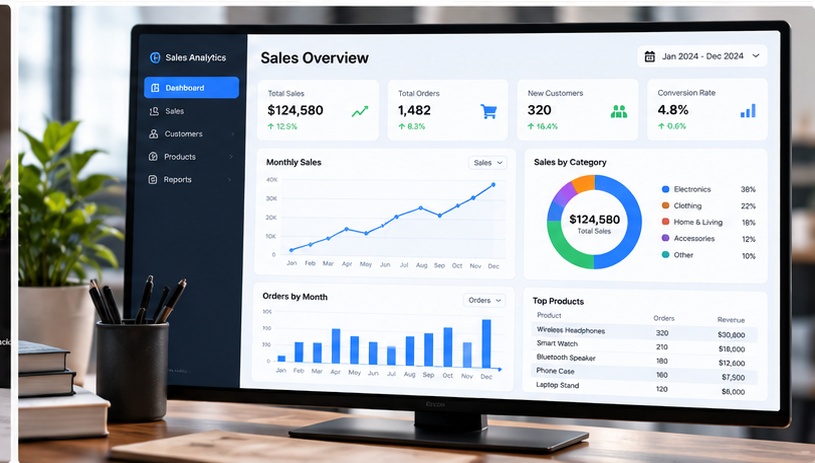
Screenshots

Have a project in mind?
Tell us what you want to build, improve or understand. We will reply with the next steps.