Data Analytics

Cleaning, analysis, dashboards and reporting using Python-based tools.

Get a Quote
Data Analytics

Overview

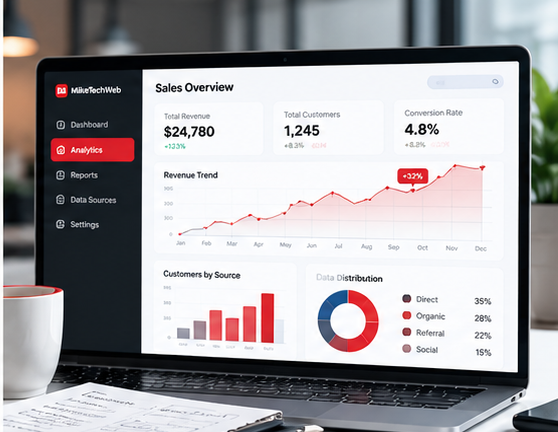
We turn raw data into information you can act on: cleaning it, analysing it, and presenting it in reports and dashboards that are easy to read.

Tools & Technologies

  • Python
  • Polars
  • Pandas
  • NumPy
  • Matplotlib
  • Jupyter

What We Deliver

  • Data cleaning
  • Data analysis
  • Data visualization
  • Dashboards
  • Reporting
  • Statistical analysis
  • Python-based analytics
  • Data automation

Problems We Solve

  • Data spread across spreadsheets and systems
  • Reports built by hand every month
  • Decisions made without clear evidence

Relevant Projects

Data Analytics

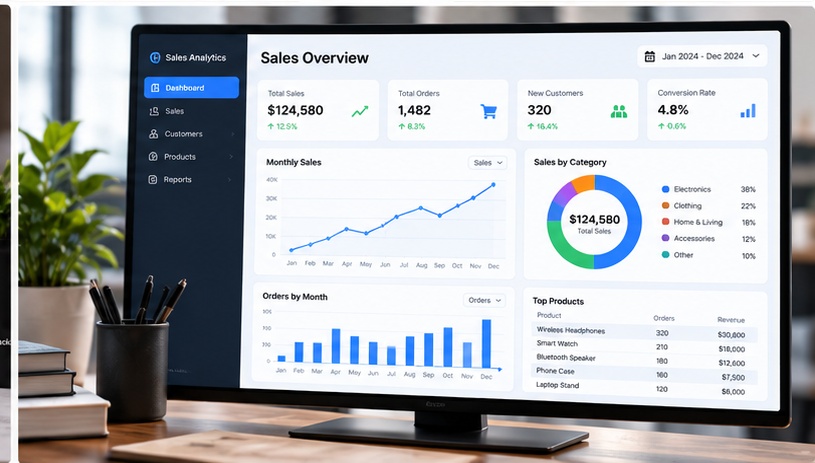
Sales Analytics Dashboard

An interactive sales dashboard designed to turn business data into clear visual insights for faster decision-making.

  • Python
  • Polars
  • Pandas
  • NumPy
  • Matplotlib
  • SQL
View Project

How We Work

  1. 01

    Discover

    Understand your goals, challenges, and requirements.

  2. 02

    Plan

    Define the solution, requirements, scope, and priorities.

  3. 03

    Design

    Shape the user experience, visual direction, and functionality.

  4. 04

    Build

    Develop and integrate the solution.

  5. 05

    Test

    Test functionality, usability, responsiveness, and quality.

  6. 06

    Launch

    Deploy the solution and provide ongoing support.

FAQ

Send a quote request or contact us with a short description of what you need. We will reply to discuss scope and next steps.

Have a project in mind?

Tell us what you want to build, improve or understand. We will reply with the next steps.